When the Opportunity Zone (OZ) program was created under the 2017 Tax Cuts and Jobs Act, it promised a new way to direct private capital toward communities most in need of investment. The idea was straightforward: use tax incentives to steer long-term investments into designated census tracts with economic challenges, helping revitalize neighborhoods and create jobs. Although, in practice, results were mixed across 8,764 OZs, the core concept—a place-based investment tool linking patient capital to community priorities—proved durable.
With the passage of the One Big Beautiful Bill Act (OBBBA) in July 2025, Opportunity Zones 2.0 aims to refine and extend the program’s reach, making it permanent and more transparent. For practitioners, this marks an important moment to prepare. New zone designations are on the horizon, and implementation efforts will determine whether the next chapter delivers on the program’s original promise.
TIP’s strong focus on implementation brings a unique vantage point to this moment. The firm assisted the City of Dallas, Texas, in developing an Opportunity Zone prospectus positioning local tracts for investment in the first OZ wave. That experience offers valuable insights as communities plan for OZ 2.0.
Lessons from the First Round
The first iteration of Opportunity Zones catalyzed more than $89 billion in estimated private investment nationwide through 2022 alone, with most estimates showing first round investments will total over $100 billion. Local leaders across over 5,600 low-income neighborhoods used the program to advance housing, commercial redevelopment, and small business projects. Notably, it is estimated that OZ investments spurred the development of over 300,000 housing units that would not have been built otherwise, with development spilling over into neighboring non-OZ areas. This is an especially important outcome in the face of a national housing supply shortage.
Data analyses suggest that the OZ program delivered varied outcomes across communities, with investment largely flowing to areas with existing private capital streams. At the same time, gaps in oversight and the absence of reporting requirements made it difficult to assess why these zones benefited most or how individual projects would align with local plans, leading some areas to face criticism over project selection and transparency. Inconsistent communication of local priorities and limited follow-through on readiness further created challenges for local jurisdictions.
The City of Dallas provides an example of both the opportunities and complexities of OZ implementation. In 2019, TIP worked with the City to prepare the Dallas Opportunity Zone Prospectus, covering 15 designated zones with a combined population of roughly 76,000 residents. Components of the prospectus included: an overview of OZs and the local economic context; zoning and land use characteristics; demographic, education, and industry profiles for each OZ; and available incentive programs for potential layering such as public-private partnerships (P3), tax increment financing (TIF), Neighborhood Empowerment Zones, and small business incentives. The analysis also highlighted investment-ready corridors and redevelopment sites aligned with citywide priorities such as housing, transit access, and employment centers.
Since the prospectus, the OZ program has drawn investment to Dallas. For example, a 279-unit development marked the entry of national developer Milhaus into the Texas market through OZ investment. Located just two miles from downtown, the project transformed an underutilized area while meeting housing demand in a high-growth market. Though individual projects like these can demonstrate success, the lack of reporting requirements in the original federal legislation has made it difficult to understand the full impact of OZ 1.0.
Even still, experience across the US showed that communities were best positioned to attract meaningful investment when they combined strong data, collaboration, and project preparation. Opportunity Alabama (OPAL) illustrates this intersection in practice. OPAL was created as a neutral “capital allocator,” and the organization spent nearly two years working with communities to define priorities, identify capital-stacking opportunities, and plan for investment-ready projects. To foster “local investment for local deals,” OPAL convened banks, high-net-worth individuals, foundations, and corporations into a shared investment infrastructure. Launched in 2021 and deploying capital beginning in 2022, this framework helped channel more than $500 million into projects over three years, demonstrating that early coordination can expand the reach of OZ tools.
These lessons from the first round set the stage for OZ 2.0’s updates to streamline eligibility, strengthen accountability, and broaden the range of communities that can benefit. They also underscore that design alone isn’t enough. The right pieces—like market-ready sites, stakeholder alignment, layered incentives, and project readiness—must be in place. As OZ 2.0 takes effect, communities that build on these foundational elements will be better positioned to draw investment.
What’s New in Opportunity Zones 2.0
The Opportunity Zones framework is now permanent under federal law, giving states and investors long-term certainty. The 2025 legislation focuses on clarity and targeted support rather than a complete overhaul.
- Tighter Criteria. OZ 2.0 removes the “contiguous tract” rule, ensuring that new designations focus squarely on areas with measurable economic need. To qualify, census tracts must either have a median family income (MFI) below 70 percent of the benchmark area or a poverty rate of at least 20 percent with MFI below 125 percent. While reducing the number of eligible tracts through tighter eligibility criteria, these changes are intended to focus investment in places that align more closely with the program’s intent. Stakeholders should note that the designation map resets every 10 years, meaning eligibility can shift based on updated federal census and American Community Survey (ACS) data.
- Rural Investment Focus. The law introduces Qualified Rural Opportunity Funds (QROFs)—investment vehicles required to deploy at least 90 percent of assets in rural OZs. QROFs benefit from enhanced incentives, including a 30 percent basis step-up after five years and a reduced “substantial improvement” threshold (50 percent instead of 100 percent). The IRS clarified these provisions in Notice 2025-50, creating a pathway for smaller and rural communities that was largely absent in OZ 1.0.
- Simplified Incentives. Investors can still defer capital gains for up to five years and increase their basis by 10 percent. Gains from qualified OZ investments held for 10 years or longer remain tax-free, and a fair market value reset after 30 years eliminates the “forced exit” concern from the first version.
- Transparency and Reporting. One of the biggest changes is the new federal reporting framework. Treasury must now release annual data on fund activity, investment totals, and job creation within zones. This reporting requirement—mandated by the OBBBA—addresses one of OZ 1.0’s main shortcomings and offers local leaders a way to benchmark progress.
Together, these changes aim to make OZ 2.0 more predictable and measurable, giving practitioners the tools to plan for sustained investment rather than short-term speculation.
Implementation Starts Now
The path to OZ 2.0 implementation is already taking shape. States will soon have a new opportunity to designate zones, but preparation must begin early to ensure local priorities are reflected when maps are redrawn.
Key Milestones
- July 4, 2025: OBBBA signed into law, making OZ 2.0 permanent
- July 1, 2026: Governors’ 90-day nomination window opens for new zone designations
- January 1, 2027: New OZ map takes effect
- December 31, 2028: Legacy OZ 1.0 designations sunset
Steps Practitioners Can Take Now
- Analyze eligible tracts. Use mapping tools like EIG’s Opportunity Zones Activity Map, Urban Institute’s 2026 Selection Tool, Novogradac’s Opportunity Zones 2.0 Mapping Tool, or state-specific mapping tools like the Texas Governor’s Office OZ portal to identify census tracts that meet the refined criteria. These tools use the most up-to-date data available; eligibility may shift slightly when the ACS is updated later this year.
- Overlay community priorities. Map zoning, site-readiness, infrastructure gaps, property ownership patterns, and incentive overlays. Actively seek community input.
- Engage early with partners. Establish roles for local government, economic development agencies, investors, developers, landowners, and community partners. Align incentives, desired uses, and readiness targets.
- Prepare investment prospectuses. Identify specific, investment-ready sites and clearly define desired outcomes such as job creation, infrastructure, or mixed-use development.
- Build the “stack” with complementary tools. Use OZ incentives as part of a larger investment framework, including public-private partnerships, tax increment financing, local grants, state incentive programs, and land assembly and clearance. Projects that combine OZ capital with local tools will be more competitive.
- Understand compliance requirements. Incorporate data reporting and transparency into early planning to simplify future reporting to Treasury.
- Consider rural opportunities. For states like Texas, the QROF incentives open new pathways for smaller communities seeking private capital for industrial sites, housing, or downtown revitalization.
- Document lessons learned. Capture insights from past OZ efforts—what worked, what didn’t, and which partnerships proved most effective? Communities that can demonstrate readiness and learning from OZ 1.0 will have a stronger case for designation in OZ 2.0.
- Use available assessment tools. The Urban Institute’s Opportunity Zone Community Impact Assessment Tool allows project sponsors, investors, and public entities to assess how likely an OZ project is to deliver community and social benefits. Users select a project type and answer questions across seven impact areas, including community goals, job access, wealth-building, housing, and environment. While results depend on input accuracy, the tool offers a useful framework for gauging an OZ project’s broader community value.
From Policy to Practice
Opportunity Zones 2.0 offers a rare policy continuity: a long-term tool refined by years of experience and strengthened through new transparency requirements. The program’s permanence means economic developers can now integrate OZ strategies directly into their broader plans for business growth, housing, and infrastructure.
As TIP’s work in Dallas and case studies like OPAL demonstrate, implementation is built on preparation. The effectiveness of OZ 2.0 will hinge on having clear priorities, credible data, and a coordinated approach to investment.
With new designations expected in 2026, now is the time for communities to revisit their earlier efforts, identify gaps, and get ready to compete for private capital under a more transparent and durable framework.
For more information on how your community can benefit from Opportunity Zones, contact TIP Strategies at contact@tipstrategies.com.
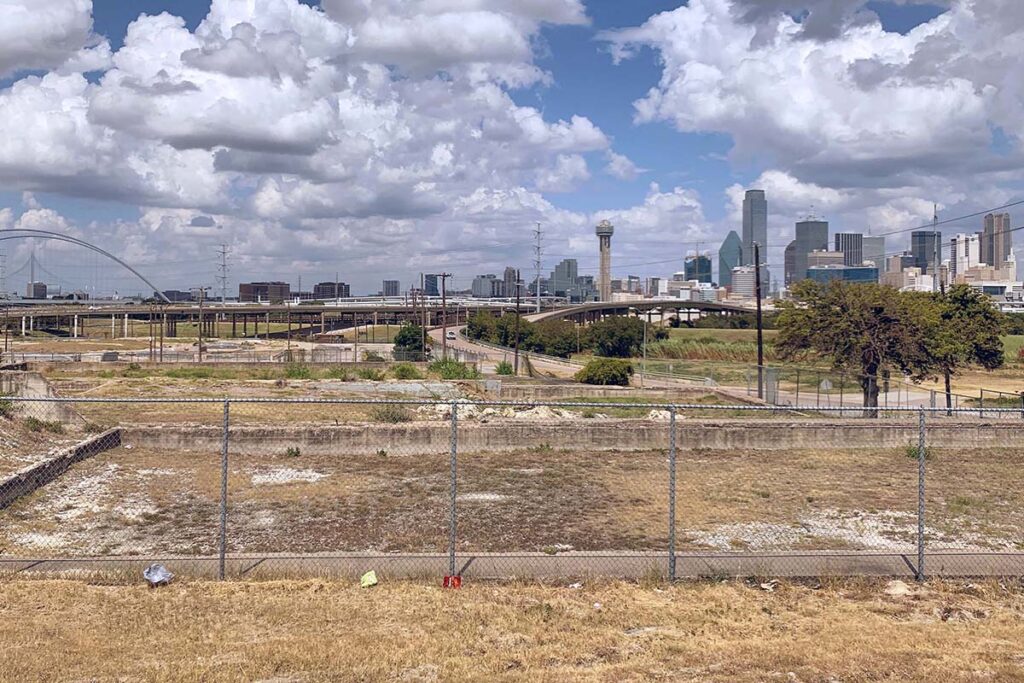
Image credit: Southern Gateway-Bridge Skyline (ECO-Lepeska) courtesy City of Dallas.