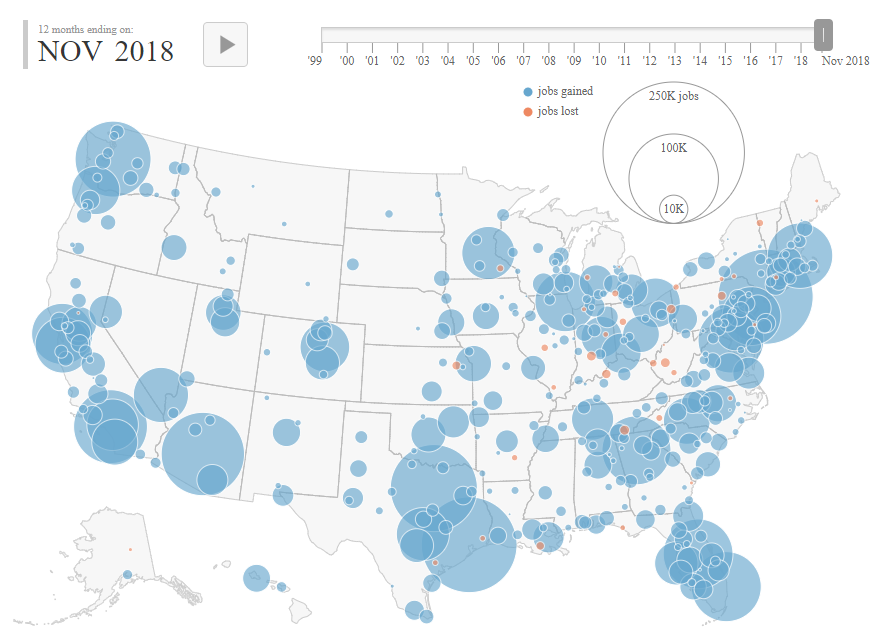
TIP Strategies tracks the ongoing ups and downs of metropolitan job growth with our Geography of Jobs interactive map. With nearly 20 years of data, the map follows two full business cycles and provides geographic perspective on patterns of job growth from the dotcom era to Hurricane Katrina, from the housing bubble to the Great Recession and beyond.
Houston added just over 114,000 jobs in the 12 months ending in November 2018, more than any other US metropolitan area. Houston’s lead in employment growth came just as the price oil began to soften in late 2018. Houston’s performance barely edged out New York, which added 113,000 net new jobs over the same period. No other metropolitan area gained in excess of 100,000 jobs, though two came close: Dallas/Fort Worth added nearly 95,000 jobs during the period and Phoenix was up by nearly 87,000.
Houston, Phoenix, Cleveland, Seattle, and New York were the five metropolitan areas experiencing the most acceleration in job growth between November 2017 and November 2018. Seattle, for example, added nearly 48,000 jobs for the 12 months ending in November 2017, but in the 12 months that followed, the net gain jumped to more 72,000 jobs.
Meanwhile, job growth slowed in metropolitan Detroit, San Antonio, Louisville, and Riverside/San Bernardino. Detroit’s gain of 48,000 jobs for the 12 months ending in November 2017 decelerated sharply to just under 13,000 new jobs for the subsequent 12 months. Detroit’s shifting momentum allowed Grand Rapids, with more than 14,000 net new jobs, to claim the title of Michigan’s employment growth leader for the period through November 2018.